You are currently viewing this website using the Internet Explorer (IE) web browser. This website has limited functionality in IE, and you won’t be able to download research documents. For an optimal experience, please access this website using any other supported web browser.
Underlying fund performance, asset allocation, and cash flows of more than 100 large defined contribution plans representing approximately $400 billion in assets are tracked in the Callan DC Index.
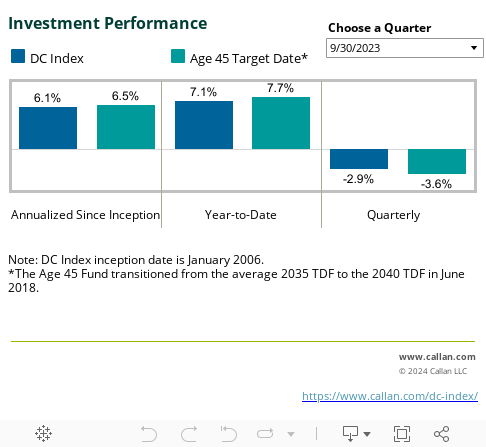
Index Dips After Four Straight Quarterly Gains
The Callan DC Index™ lost 0.2% in 4Q24, which brought the Index’s trailing one-year return to 14.3%. The Age 45 Target Date Fund (analogous to the 2045 vintage) had a lower quarterly return (-1.6%) but a higher YTD return (+14.4%). Over longer time horizons, the Age 45 TDF’s higher relative equity allocation has contributed to a higher annualized since-inception* return (7.4% vs. 7.0%).
*The Index was created in 2006.
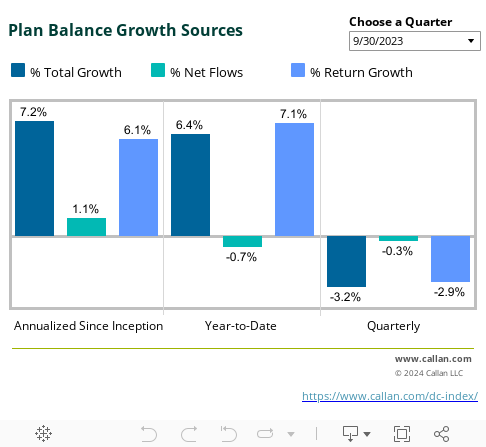
Balances Fall Due to Investment Losses and Net Flows
Balances within the DC Index fell by 0.8% after a 4.7% increase in the previous quarter. Investment losses (-0.2%) were not the primary cause as net flows (-0.6%) fell more. This figure will continue to provide a critical measure of how effectively plans retain the balances of retiring participants, who often own an outsized share of total plan assets.
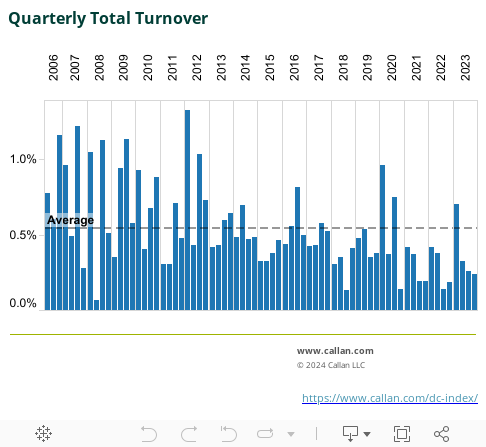
Slight Rise After All-Time Low
Turnover (i.e., net transfer activity levels within DC plans) increased to 0.11% from the previous quarter’s all-time low of 0.02%. The Index’s historical average (0.53%) remained steady.
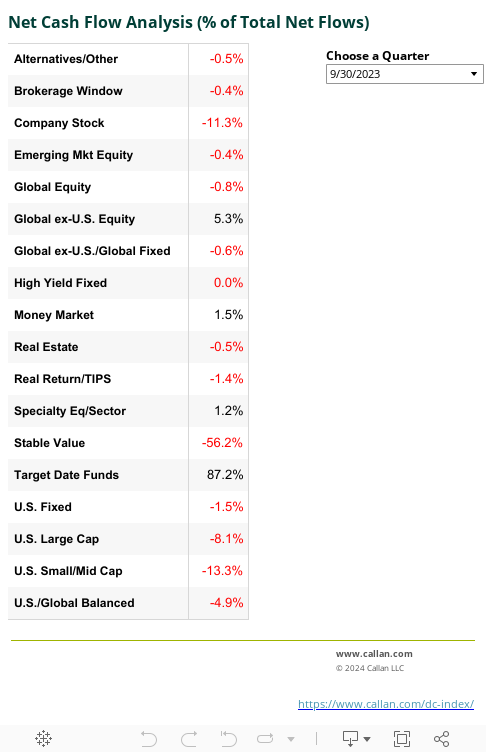
U.S. Equity Falls Sharply Two Straight Quarters
Automatic features and their appeal to “do-it-for-me” investors typically result in target date funds (TDFs) receiving the largest net inflows in the DC Index. For the second quarter, along with low turnover in the DC Index, U.S. fixed income outpaced the asset allocation funds, earning 35.7% of quarterly net flows. Brokerage windows held the top spot for inflows, receiving 40.6% of flows.
Notably, within equities, investors withdrew assets from U.S. large cap equity (-25.5%) and U.S. small/mid-cap equity (-19.1%), similar to the large outflows of the previous quarter. Stable value (-34.0%) also saw relatively large outflows for the 10th consecutive quarter. These results should not come as a surprise given the recent interest rate environment and each asset class’s sensitivity to changing rates (i.e., the longer underlying duration of a typical stable value portfolio often leads to underperformance relative to money market funds in a sharply rising rate environment).
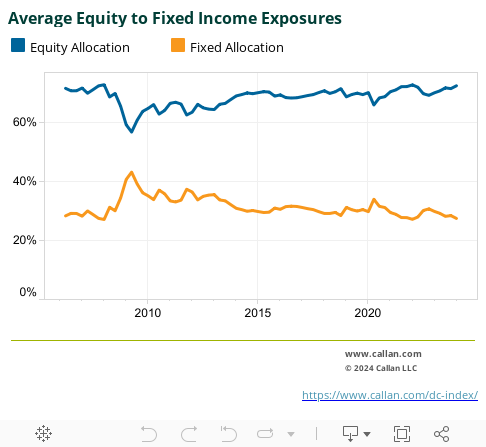
Equity Exposure Rises
The Index’s overall allocation to equity (74.4%) rose slightly from the previous quarter’s level (74.0%). The current equity allocation continues to sit above the Index’s historical average (68.8%).
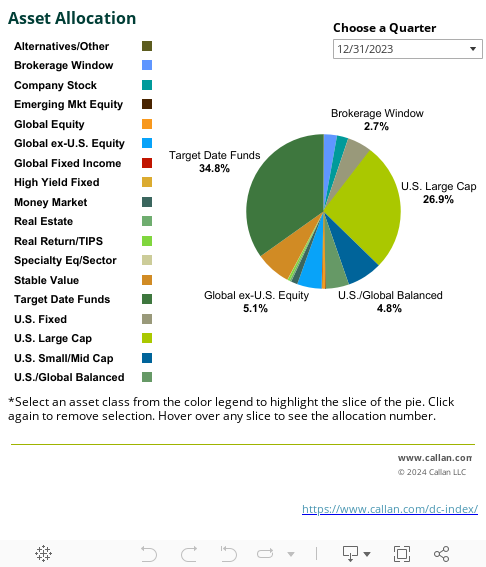
Large Cap Equity Gains
U.S. large cap equity (29.0%), target date funds (36.0%), and brokerage windows (3.1%) were among the asset classes with the largest percentage increases in allocation, while stable value (-5.6%) had the largest decrease in allocation from the previous quarter due to net outflows. Global ex-U.S. equity saw the second largest decrease in allocation (-0.36 percentage points from the previous quarter) despite investor inflows, signaling the asset class was a relative underperformer.
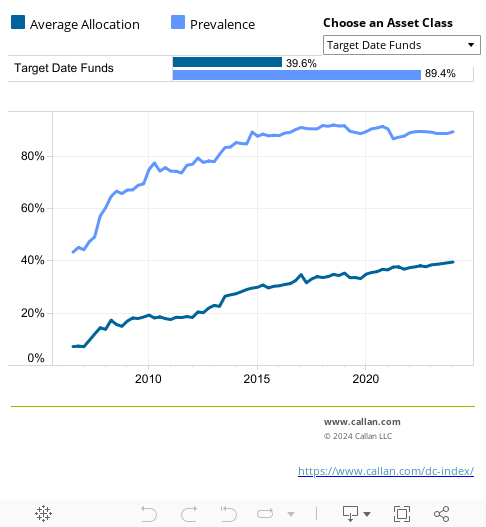
Money Markets and Inflation Hedges Gain
In the prevalence of funds table, the light blue bars indicate the prevalence of asset classes within DC plans, while the dark blue bars show the average allocation to particular asset classes when offered as an option.
The prevalence of money market funds (58.0%) rose by 3.7 percentage points and the prevalence of real return/TIPS funds (37.7%) rose by 3.4 percentage points. Other notable movements included a 3.1 percentage point decrease in the prevalence of balanced fund offerings (36.2%).
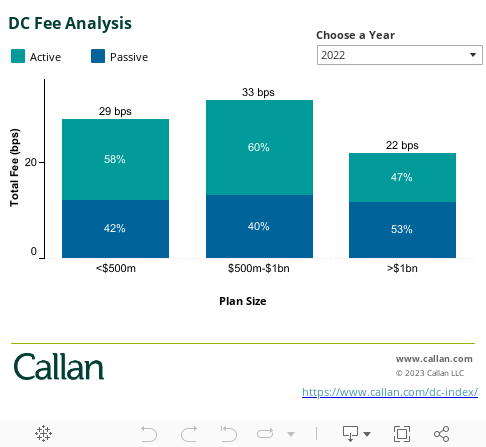
The DC Fee Analysis chart shows the average total investment management fee by plan size, as well as the average share of plan assets allocated to active and passive options. Fees for each fund (including mutual funds, collective trusts, and separate accounts) within a plan are asset-weighted to determine the average total fee. This exhibit will be updated annually with the release of third quarter DC Index results, and this updated data should be available shortly.
Using 3Q23 data, for plans with assets less than $500 million in assets, the average asset-weighted fee decreased by 3 basis points from 3Q22. Plans with assets between $500 million and $1 billion saw the largest fee decrease of 9 bps, while the fee for plans with more than $1 billion in assets had a decrease of 4 bps. Fee decreases were largely driven by a combination of increased use of passive mandates as well as lower breakpoints and new lower fee vehicles and share classes for actively managed options.
For Investment Managers & Advisers
You are now leaving Callan LLC’s website and going to Callan Family Office’s website. Callan Family Office is not affiliated with Callan LLC. Callan LLC has licensed the Callan® trademark to Callan Family Office for use in providing investment advisory services to ultra-high net worth clients, family foundations, and endowments. Callan Family Office and Callan LLC are independent, unaffiliated investment advisory firms separately registered with the Securities and Exchange Commission under the Investment Advisers Act of 1940.
Callan LLC is not responsible for the services and content on Callan Family Office’s website. Inclusion of this link does not constitute or imply an endorsement, sponsorship, or recommendation by Callan LLC of their website, or its contents, and Callan LLC is not responsible or liable for your use of it. When visiting their website, you are subject to Callan Family Office’s terms of use and privacy policies.