Nonprofit

Is This a Time for Active Managers to Shine?

Is This a Time for Active Managers to Shine?
clock
4 min 26 sec

An allocation to active management is a cornerstone of nonprofit investment portfolios. It can provide enhanced returns as well as diversification. According to the 2023 NACUBO-Commonfund Study of Endowments, university endowment portfolios have more than 80% of their assets invested with active managers. And it’s not just for the largest of the large; for endowments with less than $500 million, active management represents 67% of the allocation. These allocations are across all asset classes including equity, fixed income, and alternatives.

The returns of any portfolio can be enhanced with the selection of skilled active managers. However, history has shown us that some periods have been more favorable for active managers than others. The period beginning in 2012 up to today has been difficult for active management, especially in U.S. equity. If we had a magic 8-Ball that could tell us when to allocate to active managers and when to stick with indexing, our long-term track records would be improved. Since we do not, we will explore market measures that can provide some insight.

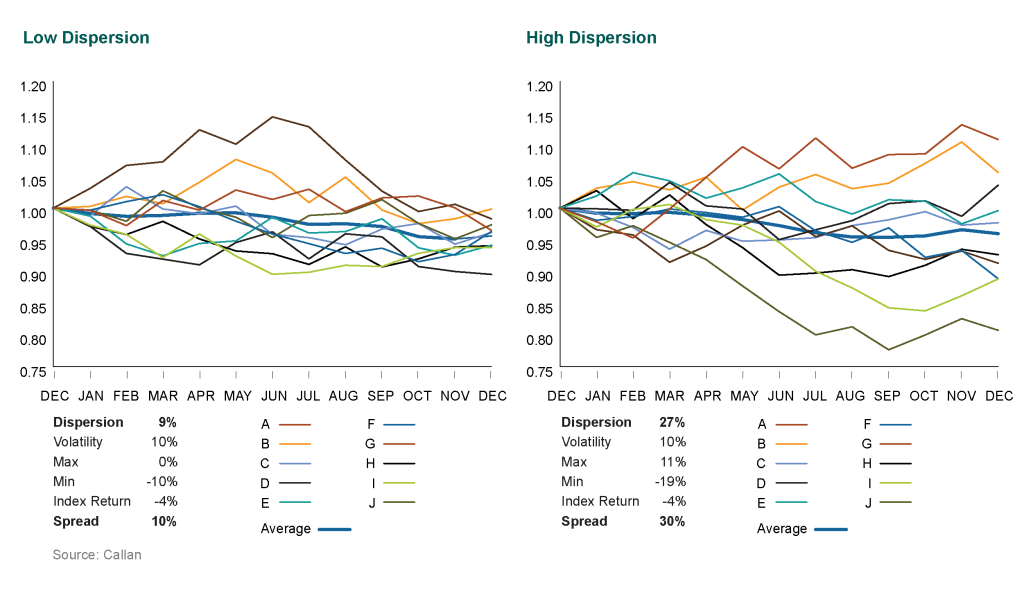
For active management to work, there needs to be a payoff for picking better stocks than the average. The magnitude of that payoff can be measured by equity dispersion. Put another way, it is the value the markets are offering for one’s intelligence as a stock picker.

What is dispersion?

Dispersion measures the spread of returns around the average. Each day indices like the S&P 500 calculate a return that is the market cap-weighted average of the returns of the individual dispersionstocks in the index. But this return figure tells us nothing about the range of returns of individual stocks and hence the opportunity set for stock picking. The measure of this range is dispersion.

Another way to conceptualize dispersion is to shoot five arrows at a target. A skilled archer will put all five arrows on the bullseye, splitting each arrow with each subsequent shot. On the other hand, your humble author is not such a great shot and may spray the arrows all over the target. The skilled archer has a grouping of arrows with zero dispersion; my dispersion, on the other hand, is very high.

Dispersion in equity indices

Let’s look at dispersion in a theoretical 10-stock index. Below are charts of two index return streams over a one-year period, including the individual stocks that make up the index. In both indices the return and volatility of the index are identical. Just looking at the volatility and return doesn’t tell us if it is a stock picker’s market.

In the low dispersion portfolio, the difference in return between the best-returning stock and the worst-returning stock is 10%. If you are a genius long/short manager and put on one perfect trade, the best you can expect is a 10% return. For the high dispersion portfolio, our genius stock picker has a 30% spread to trade. The value of the stock picker’s “genius” is greater in a high dispersion world.

Historical Context

In theory this sounds good. The real test is whether higher dispersion does in fact improve returns for active managers. The chart below shows the three-year moving average of dispersion along with the rolling three-year gross excess return of the Callan All Cap Broad Peer Group in our database over the return of the Russell 3000.

dispersion

The period from 2012 through 2020 saw dispersion below 20% and negative excess return from active management. Beginning in 2020 dispersion increased, ending at 24%. During this period active manager performance improved to 1.2% on a rolling three-year basis.

“It’s tough to make predictions, especially about the future.”
— Yogi Berra

The trend in dispersion has been increasing, but why should we assume it will continue? What is preventing dispersion from reverting to a reading below 20?

The only way we can be more confident in our assessment that dispersion is back, and with it an active management premium, is to attempt to understand some of the factors that led to the period of low dispersion and compare them with where we are today.

The most significant historical event that preceded the reduction in dispersion is the Global Financial Crisis of 2008 and the subsequent “whatever it takes” actions by the Fed and other G7 economies to bring stability to the global financial system. These actions had the impact of reducing market panic, supporting the functioning of financial markets, reducing volatility, and reducing dispersion. It took a few years for the market to settle into the new regime, but by 2012 the Fed had killed dispersion.

Then:

  • Near-zero U.S. interest rate policy
  • Fed purchase of illiquid mortgage-backed instruments
  • Fed purchase of U.S. Bank preferred shares
  • Global central bank coordination

Now:

  • Fed Funds rate at 5.33%
  • Fed assets have declined by more than 15% over the past year
  • Global rates are decoupling and currencies are exhibiting more volatility

The Fed began raising rates in March 2022, increasing them to 5.25% – 5.5% in July 2023. Just as with the reduction in rates after the GFC, there is a lag effect on increasing dispersion and other market conditions as investors, governments, central banks, and corporations adjust. These factors support more dispersion across assets. The best case scenario moving forward is some sustained moderate volatility with continued elevated dispersion.

We believe the current and future investment landscape can potentially be supportive of active management.

Disclosures

The Callan Institute (the “Institute”) is, and will be, the sole owner and copyright holder of all material prepared or developed by the Institute. No party has the right to reproduce, revise, resell, disseminate externally, disseminate to any affiliate firms, or post on internal websites any part of any material prepared or developed by the Institute, without the Institute’s permission. Institute clients only have the right to utilize such material internally in their business.

Posted by

Share
Share on facebook
Share on twitter
Share on linkedin
Related Posts
Public Markets

The Supermicro Conundrum: When Successful Small Cap Stocks Hurt Managers

Nicole Wubbena
Callan expert analyzes the impact of Supermicro on small cap growth managers.
Public Markets

Gains for Stocks Mask Wide Disparities; Little to No Change for Bonds

Kristin Bradbury
Callan expert analyzes the global stock and bond markets in 2Q24.
Operations

A Deeper Look at How We Did With Our Capital Markets Assumptions

Julia Moriarty
An analysis of how Callan's Capital Markets Assumptions performed over time by asset class.
Public Markets

Stocks Continue Rally; Bond Returns Fall Amid Rate Cut Uncertainty

Kristin Bradbury
Callan expert analyzes the performance of global markets in 1Q24 and the outlook for the year.
Public Markets

The Magnificent Seven and Large Cap Portfolios: What Institutional Investors Need to Know

Nicole Wubbena
What institutional investors need to know about the Magnificent Seven and large cap stock portfolios
Public Markets

Stocks Near a Record High, and Bonds Reverse Course

Kristin Bradbury
Kristin Bradbury analyzes global stock and bond markets in 4Q23.
Public Markets

Tough Quarter for Stocks, with Bonds Facing Third Straight Annual Fall

Kristin Bradbury
Kristin Bradbury assesses the global markets in 3Q23.
Public Markets

An Investor's Guide to the Nasdaq-100's Special Rebalance

Mark Wood
Mark Wood analyzes the special rebalance implemented by the Nasdaq-100.
Public Markets

Tech Stocks Lead U.S. Indices Higher; Rate Increases Send Bonds Lower

Kristin Bradbury
Kristin Bradbury assesses the global stock and bond markets in 2Q23.
Public Markets

Gains for Stocks and Bonds but the Ride Was Bumpy

Kristin Bradbury
Kristin Bradbury writes about the rebound in 1Q23 for global stocks and bonds.

Callan Family Office

You are now leaving Callan LLC’s website and going to Callan Family Office’s website. Callan Family Office is not affiliated with Callan LLC.  Callan LLC has licensed the Callan® trademark to Callan Family Office for use in providing investment advisory services to ultra-high net worth clients, family foundations, and endowments. Callan Family Office and Callan LLC are independent, unaffiliated investment advisory firms separately registered with the Securities and Exchange Commission under the Investment Advisers Act of 1940.

Callan LLC is not responsible for the services and content on Callan Family Office’s website. Inclusion of this link does not constitute or imply an endorsement, sponsorship, or recommendation by Callan LLC of their website, or its contents, and Callan LLC is not responsible or liable for your use of it. When visiting their website, you are subject to Callan Family Office’s terms of use and privacy policies.