Institutional investors have long been wary of sequence-of-returns risk, the possibility that the timing of bad short-term returns could harm outcomes even if the portfolio’s expected returns are achieved by the end of a long-term investment horizon.
This blog post, the first in a series, is based on my recent paper on this risk, available at the link above. Other blog posts in the series will be available here.
Both the type of return used and the outcome an institutional investor cares about can vary widely by type of investor. An institutional investor can analyze Monte Carlo simulations of the appropriate types of long-term return and key outcomes to show whether possible long-term returns align with long-term outcomes.
Quantifying Sequence-of-Returns Risk
The sequence-of-returns risk can then be quantified using Spearman’s rank correlation, a close cousin of the “standard” Pearson correlation that is commonly used by institutional investors. A correlation of 1 indicates that there is no sequence-of-returns risk because long-term outcomes display total concordance with long-term returns.
This scenario, which is admittedly unrealistic for most types of investors, involves portfolios with no inflows or outflows. Lower correlation between long-term returns and long-term outcomes indicates greater sequence-of-returns risk.
Analyzing sequence-of-returns risk does not replace other tools used to evaluate asset-allocation risks but provides complementary analysis. And for some institutional investors, especially those with a high probability of depleting assets, sequence-of-returns risk may be outsized—and they ignore it at their peril and that of their beneficiaries.
How to Quantify Sequence-of-Returns Risk for a Taft-Hartley Plan
Taft-Hartley DB plans can quantify sequence-of-returns risk by comparing possible portfolio compound returns to funded ratio outcomes. Funded ratio is a common indicator of a plan’s financial health that divides the plan’s assets by its pension liability. If the plan’s contributions, accruals, and benefit payments are not assumed to vary in response to future investment returns or inflation, the funded ratio should be a satisfactory outcome on which to measure sequence-of-returns risk.
It’s easiest to understand what sequence-of-returns risk looks like by first observing a situation where it is completely absent. Take a hypothetical example where the plan experiences zero net cash flows; i.e., contributions exactly offset benefit payments. This helps illustrate how unrealistic it is to assume sequence-of-returns risk does not impact a DB plan. Each point in the left-hand chart compares a possible 10-year annualized return on the horizontal axis to the resulting funded ratio after 10 years in the vertical axis. The non-linear relationship between a variety of return types and a variety of outcomes that different types of institutional investors could care about can make linear regression and the Pearson correlation calculation inappropriate.
The right-hand chart addresses this by ranking each observation. Specifically, percentile ranks are shown and the observations are able to be plotted on a unit square (both sides have a length of 100%). The absence of sequence-of-returns risk is characterized by a straight line and a Spearman’s rank correlation of exactly 1. This confirms that long-term outcomes display total concordance with long-term returns.

Take a real-world example of a Taft-Hartley pension plan that does not experience identical benefit payments and contributions. Its investment policy has a 10-year expected return of 6.61% and an expected funded ratio at the end of 10 years of 86%. There is considerable uncertainty around long-term returns, which in turn is the primary driver of variation in the funded ratio. Consequently, the funded ratio at the end of 10 years exhibits a standard deviation of 48 percentage points, with +/- one standard deviation shown in red around the average.
Long-term outcomes do not display total concordance with long-term returns. In other words, higher 10-year returns do not guarantee better outcomes at the end of 10 years. Instead, Spearman’s rank correlation between 10-year returns and funded ratio at the end of 10 years is 0.98. A metric less than 1 confirms the presence of sequence-of-returns risk, and even a relatively small difference such as the one in this example can have a big impact, since this rank correlation indicates that long-term returns explain 96% of the variation in outcomes (0.98 squared), but the plan shouldn’t be caught off guard by the remaining 4%.
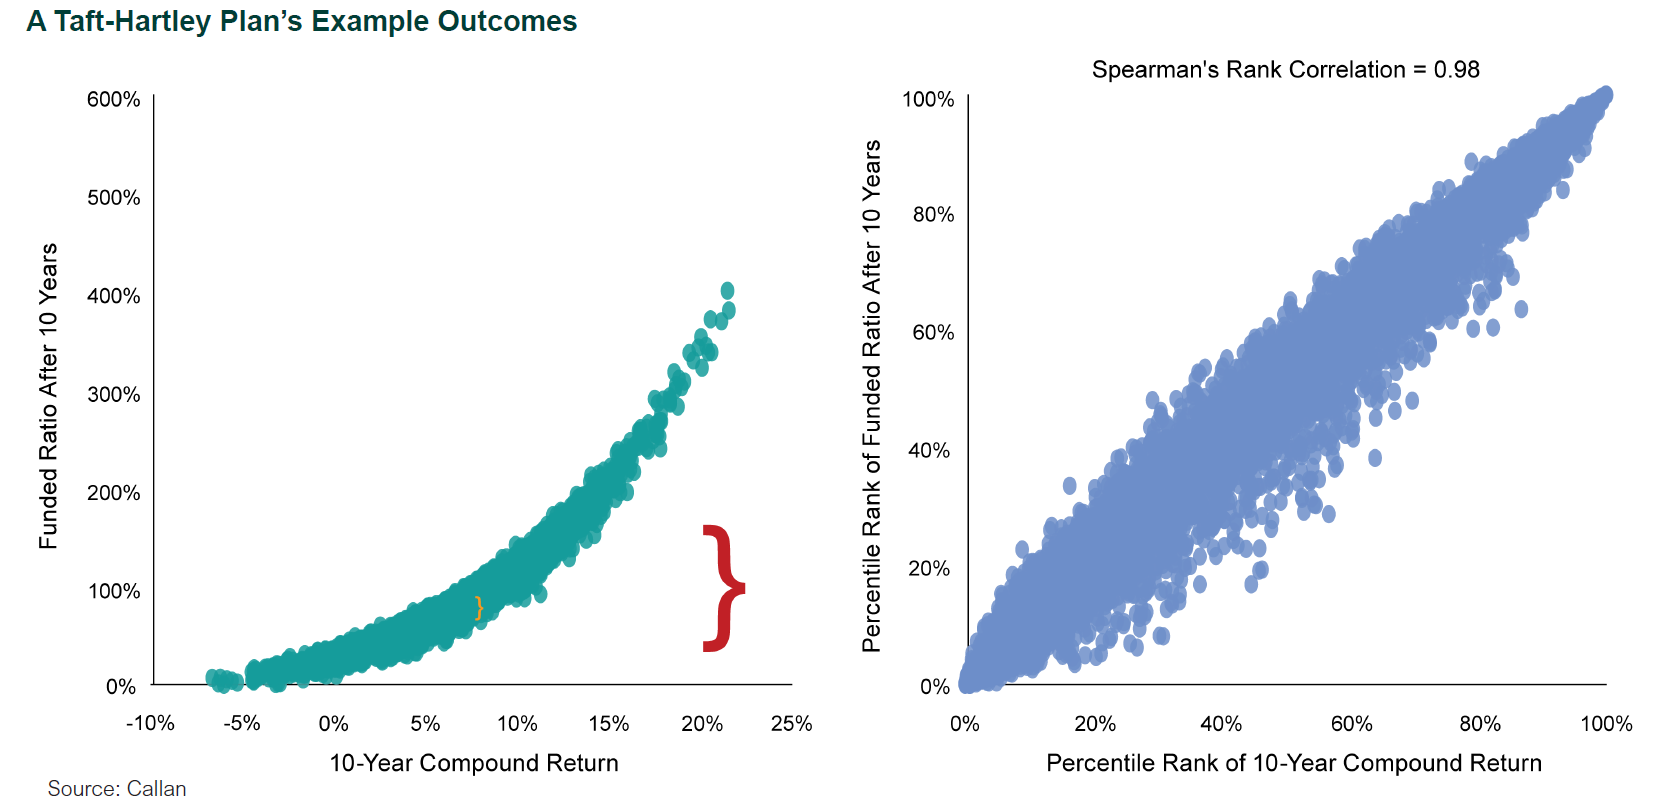
Spearman’s rank correlation can be used to further quantify this concept if the relationship between 10-year return and funded ratio at the end of 10 years is assumed to follow a Gaussian copula. Take an example where 10-year return is known to be exactly 6.61% over the 10-year period. Conditioned on achieving this 6.61% return, the portfolio would have an expected funded ratio of 77%. However, achieving the 10-year return of 6.61% does not guarantee that a 77% funded ratio will be achieved. While the vast majority of the variation in funded ratio at the end of 10 years was explained by the 10-year annualized return, a standard deviation of seven percentage points remains due to sequence-of-returns risk. Conditional expected funded ratio +/- one standard deviation is shown in orange in the chart. This corresponds to a conditional expected portfolio asset value of $6.9 billion +/- $622 million.
Disclosures
The Callan Institute (the “Institute”) is, and will be, the sole owner and copyright holder of all material prepared or developed by the Institute. No party has the right to reproduce, revise, resell, disseminate externally, disseminate to any affiliate firms, or post on internal websites any part of any material prepared or developed by the Institute, without the Institute’s permission. Institute clients only have the right to utilize such material internally in their business.