Institutional investors have long been wary of sequence-of-returns risk, the possibility that the timing of bad short-term returns could harm outcomes even if the portfolio’s expected returns are achieved by the end of a long-term investment horizon.
This blog post, one in a series, is based on my recent paper on this risk, available at the link above. Other blog posts in the series will be available here.
Both the type of return used and the outcome an institutional investor cares about can vary widely by type of investor. An institutional investor can analyze Monte Carlo simulations of the appropriate types of long-term return and key outcomes to show whether possible long-term returns align with long-term outcomes.
Quantifying Sequence-of-Returns Risk
The sequence-of-returns risk can then be quantified using Spearman’s rank correlation, a close cousin of the “standard” Pearson correlation that is commonly used by institutional investors. A correlation of 1 indicates that there is no sequence-of-returns risk because long-term outcomes display total concordance with long-term returns.
This scenario, which is admittedly unrealistic for most types of investors, involves portfolios with no inflows or outflows. Lower correlation between long-term returns and long-term outcomes indicates greater sequence-of-returns risk.
Analyzing sequence-of-returns risk does not replace other tools used to evaluate asset-allocation risks but provides complementary analysis. And for some institutional investors, especially those with a high probability of depleting assets, sequence-of-returns risk may be outsized—and they ignore it at their peril and that of their beneficiaries.
How to Quantify Sequence-of-Returns Risk for a Corporate DB Plan
An example corporate DB plan client of Callan considering a 70% growth allocation is shown in the chart below. The variety of metrics that could be prioritized by a corporate plan could vary widely depending upon investment policy and situation. These could span across balance sheet metrics, income statement metrics, contributions, and other variables.
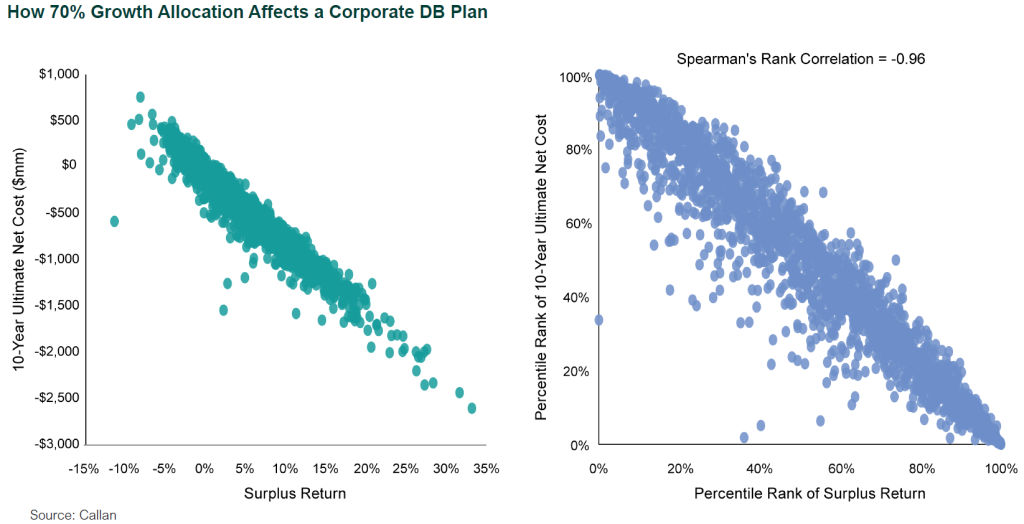
The outcome chosen for this client is ultimate net cost and shown on the vertical axis. Unfunded liability is determined on a pension benefit obligation (PBO) basis. PBO funded ratio is a commonly used indicator of a DB plan’s impact on the balance sheet of the corporate sponsor. The key return shown on the horizontal axis is surplus return, which is asset-return adjusted for PBO funded ratio minus PBO liability-return. Surplus return is a commonly used return metric for plans that pursue LDI strategies. These strategies are characterized by efforts to match the duration or interest rate risk of assets with the duration of liabilities, which can make surplus return an ideal performance metric.
Under this investment policy, the 10-year annualized surplus return has a standard deviation of 5.65% and ultimate net cost has a standard deviation of $447 million. Spearman’s rank correlation can be used to further quantify this concept if the relationship between 10-year surplus return and 10-year ultimate net cost is assumed to follow a Gaussian copula. Take an example where surplus return is 0% over the 10-year period. Conditioned on a surplus return of 0%, the static asset allocation with a 70% growth portfolio in the chart above would have an expected ultimate net cost of -$64 million, and a standard deviation of $115 million.
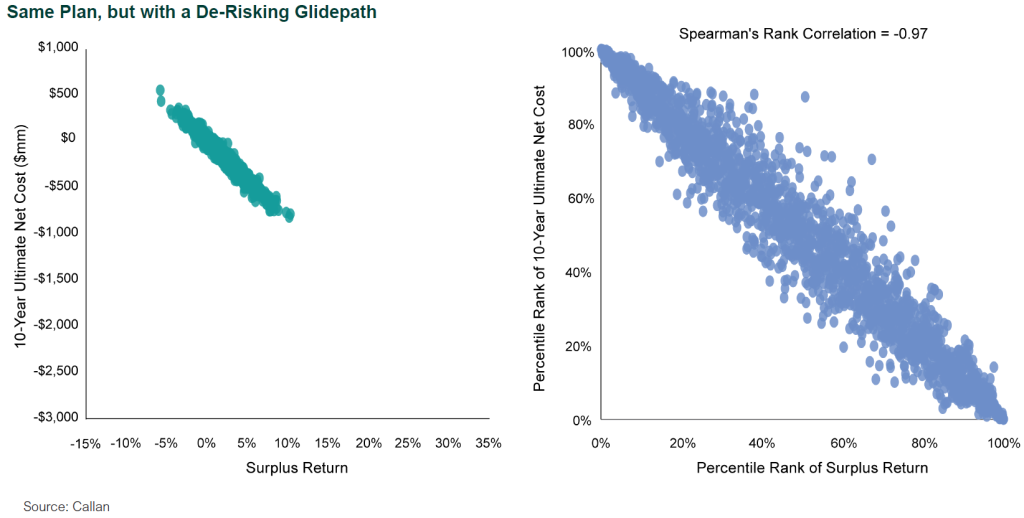
LDI strategies can also include de-risking glidepaths that alter asset allocation dynamically in response to PBO funded ratio. The same example corporate DB plan client is considering a de-risking glidepath with lower growth allocations and higher interest rate hedge ratios all along the glidepath and shown in the chart above. Spearman’s rank correlation moved to -0.97 under this alternative investment policy. Importantly, the client’s surplus risk and volatility of ultimate net cost fell dramatically to 2.08% and $178 million respectively. This is an important benefit of such glidepaths. Comparing the left-hand panels of the two charts above helps visually demonstrate how sequence-of-returns risk interacts with traditional portfolio risk metrics. Conditioned on the same surplus return of 0%, the de-risking glidepath in the bottom chart would have an expected ultimate net cost of $6 million and a standard deviation of $43 million.
Disclosures
The Callan Institute (the “Institute”) is, and will be, the sole owner and copyright holder of all material prepared or developed by the Institute. No party has the right to reproduce, revise, resell, disseminate externally, disseminate to any affiliate firms, or post on internal websites any part of any material prepared or developed by the Institute, without the Institute’s permission. Institute clients only have the right to utilize such material internally in their business.