Institutional investors have long been wary of sequence-of-returns risk, the possibility that the timing of bad short-term returns could harm outcomes even if the portfolio’s expected returns are achieved by the end of a long-term investment horizon.
This blog post, one in a series, is based on my recent paper on this risk, available at the link above. Other blog posts in the series will be available here.
Both the type of return used and the outcome an institutional investor cares about can vary widely by type of investor. An institutional investor can analyze Monte Carlo simulations of the appropriate types of long-term return and key outcomes to show whether possible long-term returns align with long-term outcomes.
Quantifying Sequence-of-Returns Risk
The sequence-of-returns risk can then be quantified using Spearman’s rank correlation, a close cousin of the “standard” Pearson correlation that is commonly used by institutional investors. A correlation of 1 indicates that there is no sequence-of-returns risk because long-term outcomes display total concordance with long-term returns.
This scenario, which is admittedly unrealistic for most types of investors, involves portfolios with no inflows or outflows. Lower correlation between long-term returns and long-term outcomes indicates greater sequence-of-returns risk.
Analyzing sequence-of-returns risk does not replace other tools used to evaluate asset-allocation risks but provides complementary analysis. And for some institutional investors, especially those with a high probability of depleting assets, sequence-of-returns risk may be outsized—and they ignore it at their peril and that of their beneficiaries.
How to Quantify Sequence-of-Returns Risk for Nonprofits
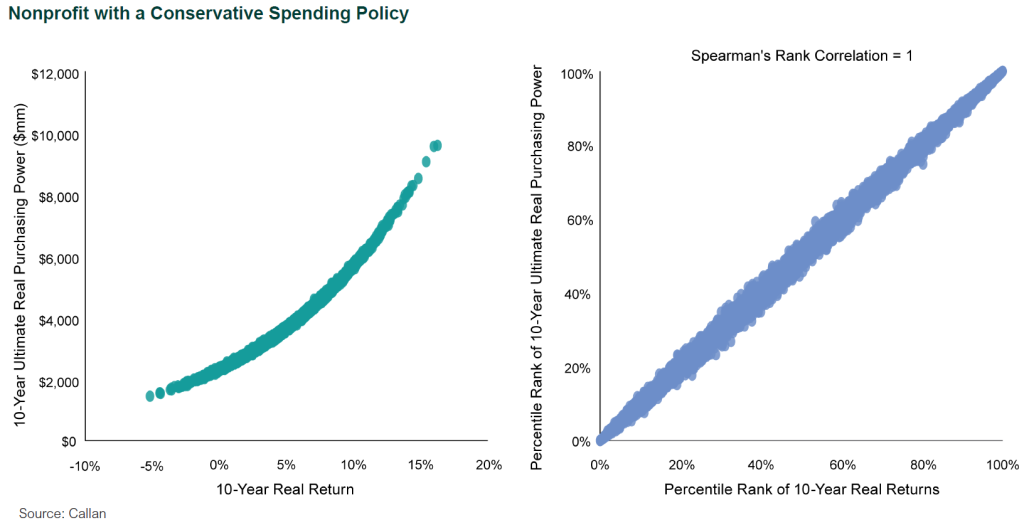
An example endowment fund client of Callan’s considering a 2% spending policy is shown in the chart below. Purchasing power preservation as measured by real spending, real value of corpus, or a combination of metrics may be an important consideration for nonprofits.
One outcome a nonprofit could look at is ultimate real purchasing power, defined as cumulative real spending over 10 years plus the real value of the corpus at the end of 10 years. This could then be compared against real return on the investment portfolio. This spending policy stands out as conservative and displays low sequence-of-returns risk. Spearman’s rank correlation is within rounding error of 1.

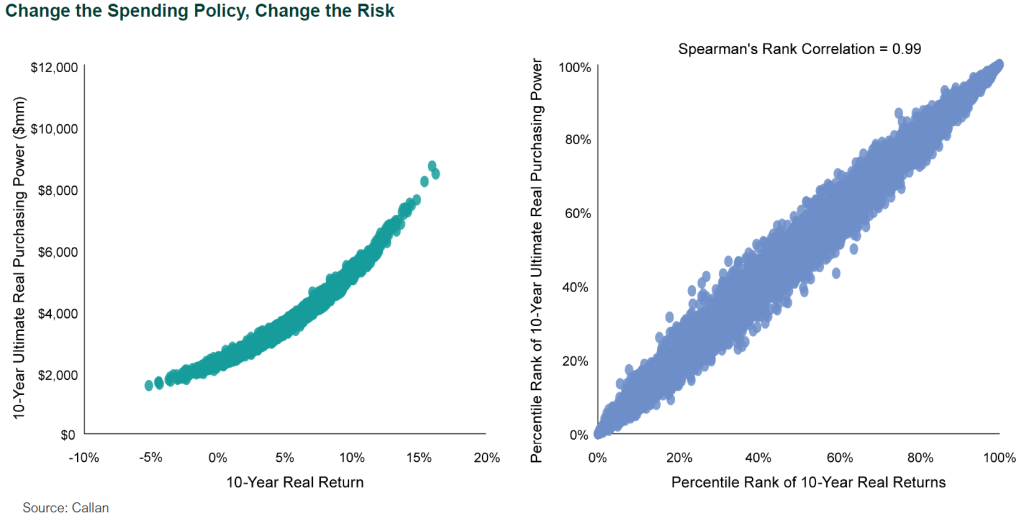
The same example nonprofit, now considering a 5% spending policy, is shown in the chart below. The charts above and below display results from the same investment policy to illustrate the difference in sequence-of-returns risk that is attributable solely to the difference in spending policy. Spearman’s rank correlation drops to 0.99 and the increase of sequence-of-returns risk attributable to higher spending from the portfolio or negative net cash flows is visible.
Spearman’s rank correlation can be used to further quantify this concept if the relationship between 10-year real return and ultimate real purchasing power at the end of 10 years is assumed to follow a Gaussian copula. For example, conditioned on a 10-year real return of 5%, the 5% spending policy in the bottom chart has an expected ultimate real purchasing power of $3.4 billion +/- $84 million compared to $3.7 billion +/- $37 million for the 2% spending policy in the top chart.

Disclosures
The Callan Institute (the “Institute”) is, and will be, the sole owner and copyright holder of all material prepared or developed by the Institute. No party has the right to reproduce, revise, resell, disseminate externally, disseminate to any affiliate firms, or post on internal websites any part of any material prepared or developed by the Institute, without the Institute’s permission. Institute clients only have the right to utilize such material internally in their business.

