You are currently viewing this website using the Internet Explorer (IE) web browser. This website has limited functionality in IE, and you won’t be able to download research documents. For an optimal experience, please access this website using any other supported web browser.
Listen to This Blog Post
Welcome to our continuing blog post series, the Callan Client Question, where we share answers to interesting issues raised by our clients.
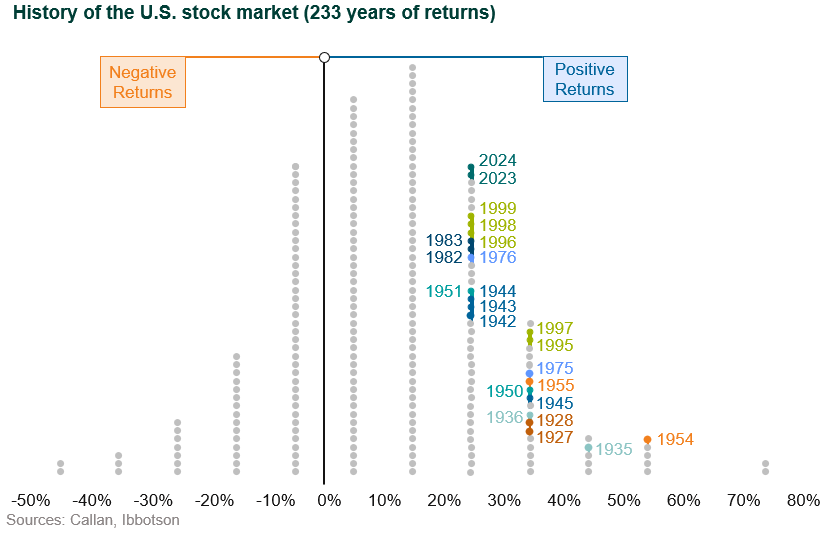
Q: What does Callan think about the S&P 500 recently completing its second straight year of 20%+ returns, the first time that has happened since the late 1990s?
A: To answer this, we did what we always do, which is to pull the data to see if we could find anything interesting.
The first step we took was to find the other occurrences (13) of two consecutive years of 20%+ gains for the S&P 500 and plotted them in the chart below. This chart represents a histogram of equity returns spanning more than 230 years. The columns show the year of the annual return in 10% increments, with positive returns displayed to the right of the vertical black line and negative returns to the left. As you would expect, all noted years fall into the 20% or greater return columns.
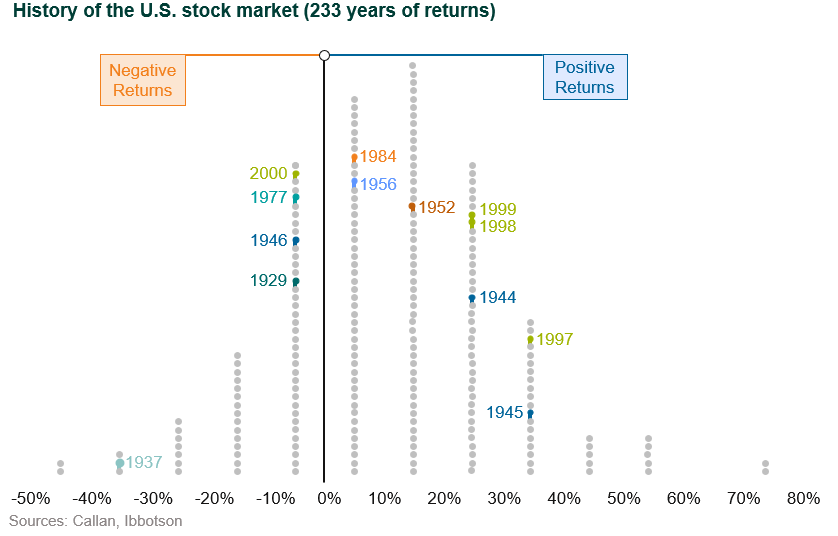
Step two was easy: identify what happened in the year immediately following two consecutive years of 20%+ returns. In 8 of the 13 instances, the following year’s return was positive with returns ranging to nearly 40%. Four years saw single-digit losses, with a negative 30% return in 1937 as the outlier. This is illustrated in the chart below.
What does this mean? Not much in isolation, but a “flash” poll I conducted in the office (basically I ambushed my Atlanta colleagues as they were leaving for the day!) found most of us surprised at the results; we thought the number and severity of negative instances in year three would have been much higher.
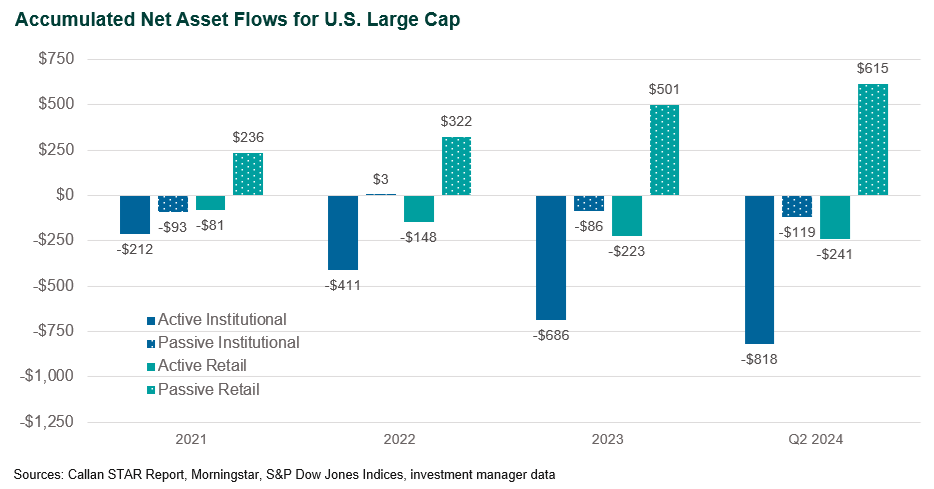
Lastly, we looked at the cash flows going in and out of the U.S. large cap space from Jan. 1, 2021, through June 30, 2024, to see if the asset flows were chasing returns. We chose this time period to examine flows before the start of the streak (more recent data is not available). When we do this analysis, we like to think of the world as a two-by-two matrix (institutional and retail coupled with active and passive). Under that framework, we noticed four things:
Our main takeaways from this exercise are:
Disclosures
The Callan Institute (the “Institute”) is, and will be, the sole owner and copyright holder of all material prepared or developed by the Institute. No party has the right to reproduce, revise, resell, disseminate externally, disseminate to any affiliate firms, or post on internal websites any part of any material prepared or developed by the Institute, without the Institute’s permission. Institute clients only have the right to utilize such material internally in their business.
For Investment Managers & Advisers
You are now leaving Callan LLC’s website and going to Callan Family Office’s website. Callan Family Office is not affiliated with Callan LLC. Callan LLC has licensed the Callan® trademark to Callan Family Office for use in providing investment advisory services to ultra-high net worth clients, family foundations, and endowments. Callan Family Office and Callan LLC are independent, unaffiliated investment advisory firms separately registered with the Securities and Exchange Commission under the Investment Advisers Act of 1940.
Callan LLC is not responsible for the services and content on Callan Family Office’s website. Inclusion of this link does not constitute or imply an endorsement, sponsorship, or recommendation by Callan LLC of their website, or its contents, and Callan LLC is not responsible or liable for your use of it. When visiting their website, you are subject to Callan Family Office’s terms of use and privacy policies.