This blog post from Callan’s Private Equity Consulting Group provides a high-level summary of private equity activity in the second quarter through all the investment stages, from fundraising to exits, as well as performance data across a range of market cycles. (Investment-stage data provided by PitchBook; performance data from Refinitiv/Cambridge.)
Private equity remains in favor with investors given its strong performance profile over the prior economic cycle and during the recent decade-long expansion. The pressure on investors to achieve historical returns in a more challenging late-cycle environment also fosters the momentum for return-seeking investments.

Fundraising
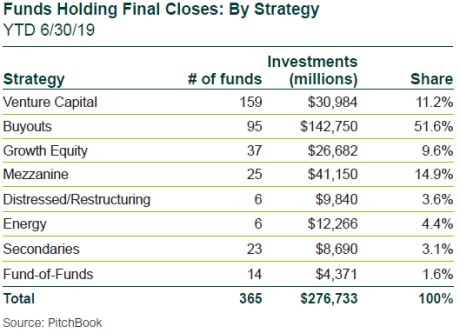
- The number of funds holding final closes in the second quarter totaled 203, up 25% from the first quarter, and commitments rose 8% to $143 billion.
- First-half final closes lagged 2018’s mid-mark, with the fund count of 365 down 21%, and commitments closed of $276 billion down 22%.
- The first-half dip in fundraising is due to a structural lull in buyouts, but a wave of large funds that previously raised capital in the 2015-17 timeframe is returning to market.
- Mezzanine is the only strategy notably above its single-digit long-term average year to date. Distressed and energy recovered from their unusually weak 1% in the first quarter.
- Buyout funds declined about 10 percentage points in their share of commitments from a strong 62% in the first quarter.
Global Company Investments
The high price environment furthered a decline in the buyout sector’s quarterly and year-to-date new investment pace.
- The number of transactions for the quarter totaled 1,424, down 12% from the first quarter. Dollar volume fell 9%, hitting $96 billion.
- The mid-year investment count and dollar volume declined 29% and 38% to 3,040 and $201 billion, respectively, compared to the first half of 2018.
VC Investments
Venture capital (VC) investments also lagged, but less so than buyouts.
- The number of rounds of financings in the second quarter fell by 15% to 4,656, but the announced dollar volume rose 10% to $55 billion.
- First-half figures exhibited less ebullience, with the count down 29% to 10,137 rounds, and announced fundings down 27% to $105 billion.
Private Equity-Backed M&A Exits
The shock in the fourth quarter capital markets and the rising price environment continued to weigh on second quarter private equity-backed M&A exits.
- The exit count was down 28% to 336. However, dollar volume popped 4% to $80 billion, bolstered by the $11 billion sale of Ultimate Software.
- The first-half exit count suffered a fall of 43% to a meager 800, and announced value plunged 55% to $157 billion.
PE-Backed IPO Exits
Second quarter private equity-backed IPOs caught momentum from the first quarter public market rally, but the dramatic increases were due to very low first quarter base numbers.
- IPOs rose 250% by count to 35 and 650% by total raised to $15 billion.
- Year-to-date totals lagged last year, with the count down 57% to 45, and the total float falling 37% to $17 billion.
VC-Backed M&A Exits
- Venture capital exits during the second quarter fell 14% to 290, and 62% by announced proceeds to $20 billion.
- First-half venture-backed M&A exits by count were down 23% to 629, but announced proceeds were up 14% from last year to $72 billion.
VC-Backed IPO Exits
A small herd of thoroughbred unicorns left the private stable, including Uber, Pinterest, and Slack, along with many other colts.
- The number of venture-backed IPO exits in the second quarter jumped by 116% to 54, and the combined new issuance leaped 340% to $22 billion.
- The mid-year IPO count is down 26% to 79 offerings, but dollar volume is up 23% over the first half of 2018 with $27 billion of aggregate proceeds.
Returns
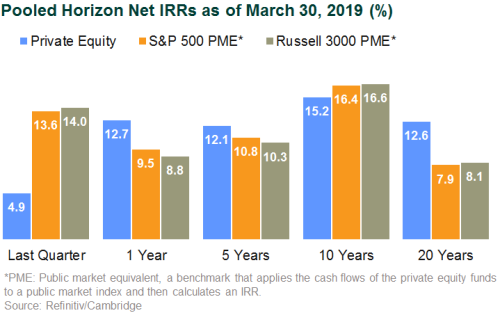
U.S. public markets roared upward in the first quarter (Russell 3000 up 14.0%) following the rout in the fourth quarter. Private equity lagged with a first quarter return of 4.9%.

- On a public market equivalent (PME) basis, the Refinitiv/Cambridge private equity database outperformed broad public equity indices over all horizons, except the 10-year mark, which marked the start of the bull market recovery.
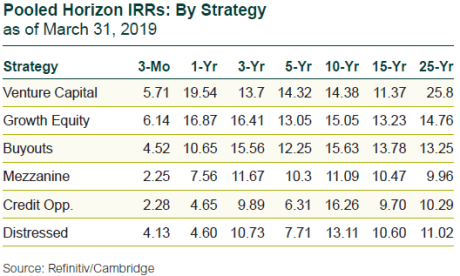
- Private equity maintains consistent double-digit internal rates of return (IRR) across investment horizons of one year or longer, and has been competitive with public equity through the public market’s remarkable 10-year rise.


