This blog post from Callan’s Private Equity Consulting Group provides a high-level summary of private equity activity in the first quarter through all the investment stages, from fundraising to exits, as well as performance data across a range of market cycles. (Investment-stage data provided by PitchBook; performance data from Refinitiv/Cambridge.)
Fundraising: Strong Start to Year Expected to Keep Going
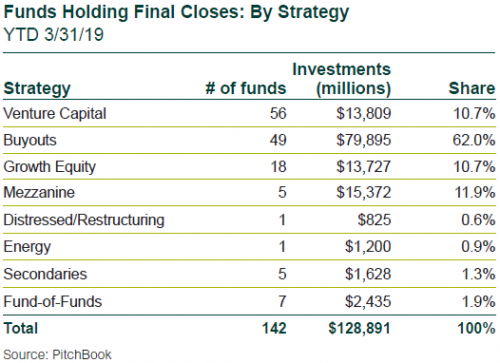
Funds holding final closes in the first quarter totaled 142, down 10% from the prior quarter. In contrast, commitments rose 19% to $129 billion. The strong 2019 start is expected to continue as an uptick in large funds returning to the market is forecast later in the year.

Buyout funds became the strategy of choice in the first quarter with a 62% share of commitments, as compared to only 40% for the full year 2018. Venture capital and growth equity showed moderate starts in 2019 with commitments of just 11% each.
Mezzanine funds had a particularly strong quarter with commitments of 12%, given that single-digits are the long-term norm. Distressed and energy strategies had unusually weak starts to the year, at less than 1% each. In the first quarter, U.S. funds received 56% of global commitments, with Europe at 33%, Asia at 9%, and the rest of the world at 2%.
Largest Funds Holding Final Closes
- Thoma Bravo Fund XIII, buyout, $12.6 billion
- Lone Star Fund XI, buyout, $8.2 billion
- Genstar Capital Partners IX, buyout, $7 billion
- No. 1 Asia-Pacific Fund: TPG Asia Fund VII, buyout, $4.6 billion
- No European-focused funds closed in 1Q19 that were over $1 billion
Global Company Investments: Big Drops for Transactions
The fourth quarter downdraft in public equity markets roiled the buyout sector’s first quarter investment pace, with new buyout investments falling markedly. The number of transactions for the quarter totaled 1,252, down 33% from the prior quarter. Dollar volume plunged 65%, hitting $67 billion.
While investment volume has fallen markedly, prices remain stubbornly high. Average buyout prices in the first quarter were 10.3x EBITDA, down slightly from the average 10.6x EBITDA in 2017 and 2018. General partners took advantage of the slight buyout price decline to cut the equity investment portion by 0.3x EBITDA to 4.5x, with debt levels holding steady in the 5.7x range.
Largest Buyout Investments
- Dun & Bradstreet, consumer finance, $6.9 billion
- Concardis, consumer products, $6 billion
- Sears Holdings, department stores, $5.2 billion
Venture Capital Investments: Key Metrics Drop by Double Digits
Venture capital (VC) investments also dropped, but not as steeply as buyouts. The number of rounds of financings in the first quarter fell by 23% to 3,332, and announced dollar volume fell 24% to $44 billion.
Large transactions still dominate with 34 financings of unicorns (VC companies with valuations of over $1 billion) in the first quarter, a notable 21% drop from the fourth quarter. The total invested was $11 billion, down 27%.
Largest VC Financings
- Chehaoduo, social/platform software, $1.5 billion, fourth round, SoftBank Group
- Flexport, logistics, $1 billion, sixth round, SoftBank Group
- Nuro, automotive, $940 million, third round, SoftBank Group
PE-Backed M&A Exits: Big Drops After Public Market Tumult
The fourth quarter capital markets’ tumult also impacted first quarter private equity-backed M&A exits. Exit count fell by 39% to only 369, and announced value plunged 50% to $71 billion.
Largest Private Equity-Backed M&A Exits
- Newfield Exploration, energy exploration, $5.5 billion
- Esterline Technologies, aerospace & defense, $4 billion
- Dorna Sports, media & information services, $3.3 billion
PE-Backed IPO Exits: Steep Plunges to Start the Year
Only eight private equity-backed IPOs occurred in the first quarter, off 70% from 27 in the fourth quarter. The total float fell by $8 billion (80%) to $2 billion.
Largest Private Equity-Backed IPO Exits
- Embassy Office Parks, real estate services, $660 million
- New Fortress Energy, energy transportation, $300 million
- China Risun Group, conglomerates, $260 million
Venture-Backed M&A Exits: Down but Relatively Stronger
Venture capital exits were down, but not as steeply as buyouts. Venture-backed M&A exits by count fell 22% to 264, and announced value declined a modest 7% to $38 billion.
Largest Venture-Backed M&A Exits
- Qualtrics, media & information services, $8 billion
- Auris, surgical devices, $5.8 billion
- Tesaro, pharmaceuticals, $5.1 billion
Venture-Backed IPO Exits: How Will Markets Receive the Unicorns?
The number of venture-backed IPO exits slowed in the first quarter, off by 34% to 23, but the combined new issuance held steady with the prior quarter at $4 billion.
Lyft’s significant $2.3 billion IPO helped stabilize the new issuance value, and is the first in an expected series of long-standing unicorns that have expressed plans to go public this year. These include Slack, WeWork, and Airbnb.
If public markets stay receptive, 2019 could be a watershed year for the start of liquidity in investors’ large unrealized venture valuations. However, headwinds seem to be rising as two early-2019 bellwether IPOs, Lyft and Uber, have traded down from their offering prices, and public equity markets have shown more volatility.
Largest Venture-Backed IPOs
- Lyft, automotive, $2.3 billion
- Cstone Pharmaceuticals, biotechnology, $284 million
- Gossamer Bio, biotechnology, $276 million
Returns: Private Equity Vaults to Outperformance
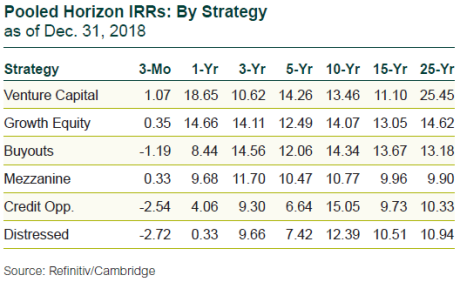
U.S. public markets experienced a rout in the fourth quarter and the declines rippled through recent horizon periods. Private equity’s 0.6% fall outperformed U.S. public market indices by about 13 percentage points during the quarter.

On a private market equivalent (PME) basis, the Refinitiv/Cambridge private equity database outperformed broad public indices over all horizons except 10 years, which is a photo finish.
Even with a difficult fourth quarter, private equity maintains consistent double-digit internal rates of return (IRR) across all the standard investment horizons of one year or longer, and has been competitive with public equity through the public market’s remarkable 10-year rise.
For more information on private equity, please contact Callan’s Private Equity Consulting Group at [email protected]
