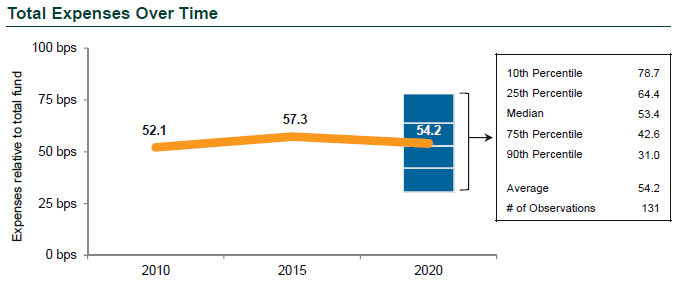
Institutional investors paid an average of 54.2 basis points for total fund expenses, according to Callan’s 2021 Cost of Doing Business Survey, a 5% drop from 2015 and the first decrease in the history of our survey. The vast majority of those expenses went toward external investment management fees, which fell 4% from 2015.
This year’s survey reflects trends on 2020 expenses for 163 organizations representing 194 plans with more than $975 billion in assets under management (AUM), including public defined benefit (DB) plans, corporate DB plans, and nonprofits. Public plans accounted for 44% of respondents, the largest investor type represented. By industry, the largest share of respondents came from the government sector, at 36%. Organizations with less than $2 billion in AUM represented 70% of respondents.

The survey also found that respondents allocated 35% of their portfolios to U.S. equity, down 6 percentage points from 2010. Nearly 60% of that allocation went to passive strategies. In terms of alternative asset classes, the share of respondents with allocations to hedge funds fell 4 percentage points from 2015, while the share with allocations to private equity and real assets rose 1 and 3 percentage points, respectively. But allocations to alternatives varied widely by investor size, with large funds (more than $10 billion AUM) allocating 25% on average, compared to 14% for medium-sized funds ($2 billion-$10 billion), and 10% for small funds (under $2 billion).
This blog post provides a high-level summary of our survey’s findings, organized by topic:
Investment-Related Expenses
- Average total expenses by investor size ranged from 56.1 bps for small plans, to 43.8 bps for medium plans, to 53.6 bps for large plans, due to their greater usage of higher-fee alternative asset classes.
- By investor type, nonprofits paid the most, at 72.1 bps, due to their relatively higher allocations to alternative asset classes. Public plans paid 51.4 bps and corporate plans paid 48.2 bps.
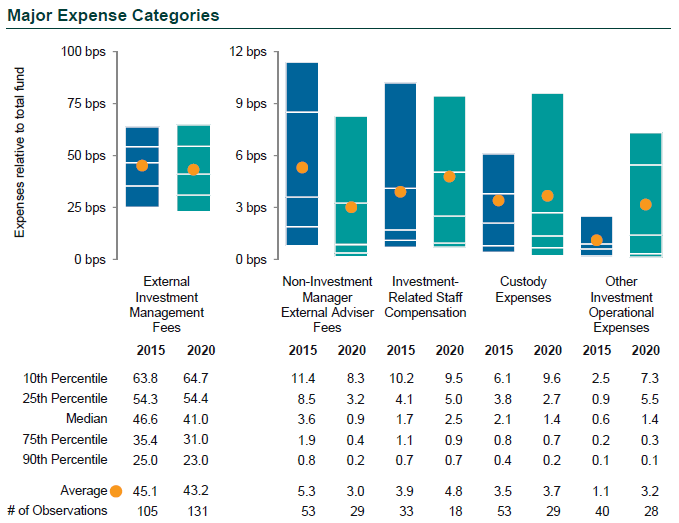
- The average external investment management fee was 43.2 bps, down 1.9 bps from 2015.
- Large plans paid the highest investment management fees, at 51.5 bps on average, again due to their relatively higher allocations to alternative asset classes. Medium funds paid 40.0 bps and small plans paid 42.5 bps.
- By investor type, nonprofits paid the highest average management fees, at 52.5 bps, while corporate plans paid the lowest, at 36.3 bps.
- Investment-related staff compensation jumped 23%, the largest percentage increase of any major expense category.

Custody Fees
- The average fee for custody services was 3.7 bps. By investor size, the average fee ranged from 5.6 bps for small funds to 0.3 bps for large funds, which greatly benefit from their scale and from efforts by the largest custodian banks to increase market share.
- In terms of the use of custody services, 81% of respondents employed global custody services for U.S. assets and sub-custody of non-U.S. assets, the highest share for any category.
External Investment Managers
- Respondents had on average 17 investment managers for their private equity allocations, the most of any asset class. Real assets at 12 and hedge funds at 8 rounded out the top three.
- Public asset classes had smaller numbers, with 4 for U.S. equity and 3 for both global ex-U.S. equity and fixed income.
Staffing
- Large funds had on average 13.3 dedicated staff members (referring to employees who have few if any responsibilities beyond fund management). This is five times the number for small funds.
- For all respondents, non-dedicated staff declined 44% since 2015, to 3.1 on average. And the average number of total staff fell 12% since 2015, to 10.0.
Oversight
- 38% of respondents used both a board of directors and an investment committee to handle fund oversight.
- 53% of board members were elected, vs. 13% who volunteered. On average respondents had 10 board members.
- 63% of investment committee members were appointed compared to only 5% who volunteered. The average committee size was 7 members.
Other Findings
- Respondents cited the Highway and Transportation Funding Act of 2014 as the regulation with the greatest impact on expenses. Rules regarding the COVID-19 pandemic came in second.
- 44% of respondents planned to review and/or renegotiate their fees over the next one to two years.
Please find the full details of our survey at the link below.

