Listen to This Blog Post
This is the third of three blog posts based on our recent white paper, available at the link above.
From a lender’s viewpoint, net asset value (NAV) loans, a type of lending to investment funds and asset managers in which the cash flows and the value of the fund’s underlying assets serve as collateral for the loan, provide attractive risk-adjusted returns and diversification opportunities. By lending against a diversified portfolio of seasoned assets rather than single assets, NAV loans reduce volatility and offer transparency into the portfolio’s performance and value-creation potential. Cross-collateralization and seasoned cash flows often result in high credit quality and, in some cases, investment-grade ratings.
For institutional investors, NAV loans can complement alternative credit portfolios, offering yields above public market equivalents and competitive returns compared to direct lending. Low loan-to-value (LTV) ratios, a diversified pool of collateral, and priority on the cash flows from the collateral pool can make NAV lending a high quality and attractive source of income for lenders:
- Lower risk due to the diversified collateral pool and lower LTV ratios (vs. continuation vehicles (CV), single-asset dividend recap)
- Default risk is mitigated by high-quality, seasoned companies coupled with loan covenants
Due to strict capital reserve requirements imposed on banks, NAV loans are now primarily provided by specialist private credit funds, some of which are stand-alone NAV finance-focused managers, while others are large private credit platforms that have added an NAV financing capability. Investors can now participate directly through dedicated specialist funds to gain focused exposure to NAV loan opportunities.
Size of NAV Finance Market and Future Growth of the Industry
Based on data provided by prominent players and service providers in the NAV finance market, the current size of the market is estimated to be around $50 billion. With a global private equity market valued at approximately $5 trillion, NAV lending represents only 1% of the ecosystem, highlighting its relatively small footprint.
However, as private equity funds encounter growing challenges in exiting investments due to wider bid-ask spreads with persistently high interest rates, many are exhausting their reserved capital to support portfolio companies. With increasing competition in private equity markets for LP capital, there is a strong motivation to outperform peers by enhancing capital efficiency—deploying 100% of committed capital or even exceeding it by recycling early distributions to generate higher returns for their funds. Rising interest rates have also increased the debt service burden for portfolio companies, stifling their growth. GPs are seeking solutions to alleviate these burdens and reignite growth. Simultaneously, many GPs are struggling to raise capital for new funds, partly due to LP liquidity constraints driven by slower distributions.
Given these dynamics, the NAV finance market is projected to expand at a compound annual growth rate (CAGR) of 20%, reaching approximately $150 billion by 2030.
The collateral for NAV loans typically consists of a portfolio of investments. Larger fund sizes usually correspond to a greater number of underlying assets, and these assets often represent higher-quality companies with diversified customer bases, strong management teams, and ample resources to support their growth. Larger funds with more portfolio companies and higher-quality assets generally secure lower interest rates, with banks and insurance companies being the natural lenders. In contrast, smaller funds with fewer assets typically face higher interest rates and attract more specialized lenders.
While the structure of NAV loans can vary, the following outlines a common framework for an NAV loan provided to a single primary private equity fund:
- Senior secured floating loan
- Tenor of 3-5 years
- LTV of 10%-20%
- Covenants: LTV limit
- Collateral includes 5-20 assets (portfolio companies)
- Payments of the NAV loans are typically funded by the cash flow derived from the underlying assets (portfolio companies) from their realizations
NAV facilities are typically bespoke loans that can take various forms. The borrower entity could be a fund, an existing special-purpose vehicle (SPV) under the fund, a newly created SPV, or other structures.
Initially, when banks offered NAV loans, they typically used all underlying assets (portfolio companies) as collateral. However, as banks have withdrawn from the market due to capital reserve constraints, private lenders and asset managers have stepped in, offering greater flexibility and a wider range of NAV loan structures. Some of these loans use only a subset of assets as collateral (collateral-light). NAV loans may also be recourse-light, meaning the lender’s recourse is limited to specified assets. Additionally, lenders may require credit enhancements, such as a parent company guarantee for offering recourse-light.
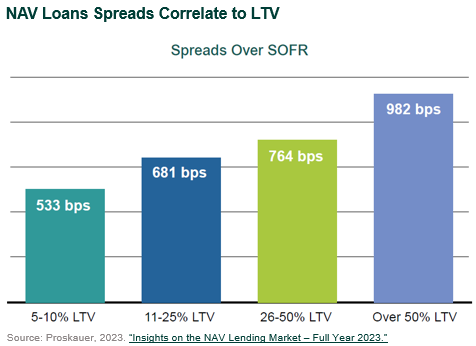
Typical points of negotiations between lenders and borrowers are pricing and waterfall. Lenders typically earn original issue discounts (OID) of 1%-3%. Spreads over base rates are generally dependent on the level of LTV. The higher the LTV ratio, the higher the spreads, according to Proskauer in a 2023 report.
According to the same Proskauer report, in terms of collateral package and credit support, the majority, 63%, is backed by cash accounts that receive cash flows from underlying assets. Additionally, 38% are backed by equity pledges, and 9% are supported by fund guarantees.
Most NAV financing solutions are bespoke, resulting in diverse structures. As previously noted, lenders typically tailor pricing and waterfall provisions for each transaction based on risk. Key factors influencing spreads include LTV ratios and fund size (or portfolio size). However, the variation in spreads—and by extension, the strategy’s target return—is also shaped by risks such as the following:
- Type of strategy (buyout, growth, venture, secondary, credit, real estate, infrastructure (all private))
- Quality of GPs
- Quality of portfolios (portfolio maturity (seasoning), portfolio concentration, industry exposure)
- Quality of underlying assets (performing, stressed, non-performing, level of leverage)
- Structure (PIK coupon, covenants, waterfall, collateral-lite, recourse-lite)
Disclosures
The Callan Institute (the “Institute”) is, and will be, the sole owner and copyright holder of all material prepared or developed by the Institute. No party has the right to reproduce, revise, resell, disseminate externally, disseminate to any affiliate firms, or post on internal websites any part of any material prepared or developed by the Institute, without the Institute’s permission. Institute clients only have the right to utilize such material internally in their business.