Listen to This Blog Post
Audio PlayerIn public U.S. equity, there are four widely adopted index families that serve to confer a benchmark for active managers or can be used as building blocks for passively implemented portfolios. These families—S&P Dow Jones, FTSE Russell, the Center for Research in Securities Pricing (CRSP), and MSCI—generally construct their indices in a way that makes the overall broad U.S. equity picture look similar.
But they also have certain key differences that, if the picture were cut into a puzzle, the pieces would fit differently. These differences may seem small but have important structural implications that could lead to unintended biases for institutional investors. In an environment in which index concentration remains a persistent theme, it is important to be aware of these differences to avoid surprises that can arise from mixing the pieces of different index families.
A brief description of each index family is in order, beginning with the most widely recognized index—the S&P 500. As the name would suggest, there are approximately 500 stocks represented by the index. Given that there are over 3,000 stocks traded on U.S. exchanges, there are some noteworthy cuts to get to an index of 500. While S&P does offer a Total Market Index, the more popular S&P 500 represents a subset of stocks that are mostly large/mega cap and have demonstrated four consecutive quarters of GAAP profits. An Index Committee governs additions and deletions from the S&P indices based on certain criteria that are not purely rules-based and mechanical. One could reasonably argue that this earnings requirement, or financial viability criteria as S&P calls it, is a quasi-active screen.
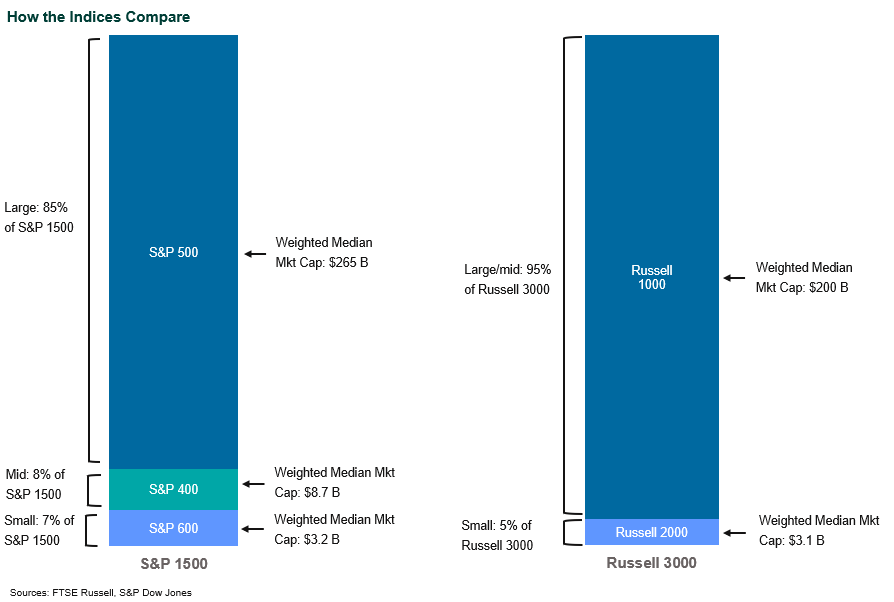
There is also an S&P 1500 Index that expands representation beyond large cap and includes middle and small cap companies. Building up to the S&P 1500, large/mega cap stocks are represented by the S&P 500, mid-cap is represented by the S&P 400, and small cap by the S&P 600. This financial viability criteria is unique to the S&P 1500, as the S&P Total Market Index and other index families do not have this earnings requirement.
The Russell indices tend to be the most widely used benchmarks for active managers. In addition, there is wide product availability for those desiring to replicate the Russell indices in a passive portfolio. The Russell 3000 can be thought of as the broad market. Typically, the building blocks of the Russell 3000 are the Russell 1000 (large and mid-cap companies) and the Russell 2000 (small cap), though there are more permutations along the capitalization spectrum. For example, for those wishing to distinguish between large and mid, Russell also offers a Top 200 index as a proxy for large/mega cap stocks, with the Russell Mid Cap representing the remaining 800 stocks in the Russell 1000. The important point, as it relates to building U.S. equity structures, is that the Russell 1000 includes a 20% weight by market value to mid cap securities. The peripheral style versions—the Russell 1000 Value and the Russell 1000 Growth—are most often used to benchmark active large cap managers.
The University of Chicago’s Center for Research in Security Prices (CRSP) index offerings were not widely known to retail and institutional investors until 2012, when several Vanguard U.S. index funds switched from tracking various MSCI indices to tracking CRSP indices. Vanguard’s pivot notwithstanding, MSCI remains widely adopted as a benchmark for non-U.S. and global investment managers. However, the MSCI U.S. indices appear to have limited adoption by U.S.-based investors as a standalone U.S. index. Typically if an investor has adopted a global framework to public equities, the default benchmark is the MSCI ACWI (All Country World Index). Note that MSCI standard indices are mostly made up of large cap securities, while the Investable Market Index (IMI) includes large, small, and mid-cap securities.
At the total market index level, the Russell 3000 Index, the CRSP US Total Market Index, and MSCI USA Investable Market Index (IMI) are very similar. But in the segmentation of capitalization, there are meaningful differences in how MSCI and CRSP categorize large, mid, and small cap companies relative to Russell. The CRSP Large Cap index is defined as 85% of the total market index and, even though the name implies large, includes what others would define as mid cap. The weighted median market capitalization of the CRSP Small/Micro Index of $7.7 billion is more than double the weighted median market capitalization of the Russell 2000. Including any CRSP mid-cap index would lead to duplication in mid-cap stocks. For Russell, large is defined as the top 200 companies, mid-cap is defined as companies #201-1,000, and small cap is defined as companies #1,001-3,000. These distinctions have led to observable differences in both the performance and characteristics for the various small and mid-cap options that track the respective benchmarks.
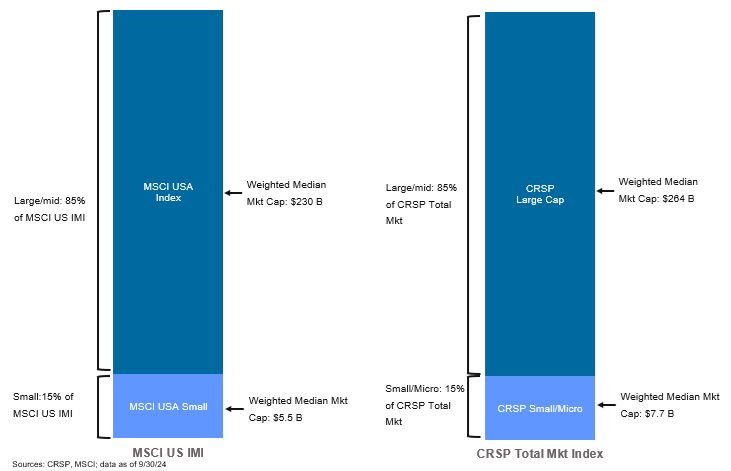
This has applications for many investor types. One is helping an institutional investor determine a reasonable, benchmark-neutral strategic weight to small cap in a U.S. equity structure. For an asset owner benchmarked to Russell 3000, the weight of the Russell 2000 Index has historically averaged around 7% of the broader index but is currently near a historical low of 4.6%. For an asset owner benchmarked to MSCI USA IMI, the weight of the MSCI USA Small Cap Index is 15% of the broader benchmark. The benchmark neutral weight to small cap could also vary if the S&P 500 is the relevant benchmark in large cap.

Another example might be a defined contribution (DC) plan that offers participants a menu of active options along with a passive equity option that tracks the S&P 500. In an event where the plan fiduciaries decide to expand the passive menu to include small and mid cap U.S. equity, favoring products that are from the same index family will help avoid duplication in capitalization segments. Typically, we see product availability around the Russell 2500 or the S&P Strategic Completion Index, but little in the way of offerings for an S&P 1000 Index (small/mid). The performance differential between the Russell 2500 and the S&P 1000 Index is noteworthy as weeding out the non-earners has helped.

The caveat emptor for institutional investors is to pay close attention to the index nomenclature and be aware that each index is constructed similarly, but not the same. Small cap is a relative term. Most of the S&P indices require earnings, the others do not. Finally, the S&P 500 is the most narrow index of the bunch and should be paired with small and mid cap to better approximate the broad market. On the surface these differences may appear minor but could result in unintended bias and/or performance disparities when piecing the different index families together.
Disclosures
The Callan Institute (the “Institute”) is, and will be, the sole owner and copyright holder of all material prepared or developed by the Institute. No party has the right to reproduce, revise, resell, disseminate externally, disseminate to any affiliate firms, or post on internal websites any part of any material prepared or developed by the Institute, without the Institute’s permission. Institute clients only have the right to utilize such material internally in their business.